Hamza Arshad












 I work as Student & Self Taught Developer
 Currently working on Open Source Projects
 Currently learning TypeScript, Next.js & Svelte
 Based in Kharian, Gujrat, Pakistan
 I work as Student & Self Taught Developer
 Currently working on Open Source Projects
 Currently learning TypeScript, Next.js & Svelte
 Based in Kharian, Gujrat, Pakistan














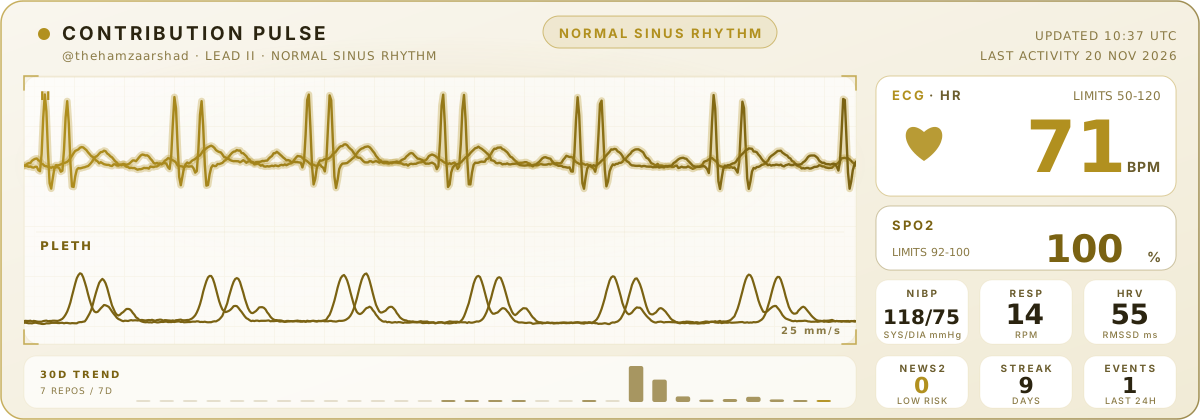
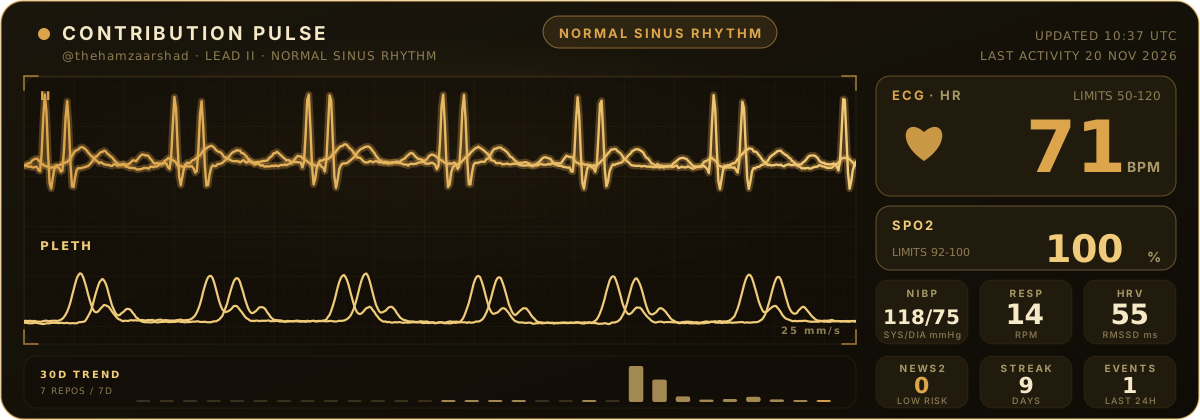
An ICU bedside monitor driven by my real GitHub activity. It behaves like a real heart: it rests while I'm idle, speeds up while I work, and recovers afterwards. Updates every ~5 minutes via GitHub Actions.
 How to read my vitals
 How to read my vitals
- HR (BPM): Live effort. Rests at ~70. Every recent event (push, PR, review, issue) ramps HR up toward ~130 within minutes, and it recovers over ~35 minutes after I stop
- SpO2 (%): Oxygen saturation. Healthy 97-99%, dips about 1% at full effort. Consistency (active days) nudges it slightly
- NIBP (mmHg): Blood pressure. ~118/76 at rest. Systolic rises up to ~148 while working, diastolic barely moves
- RESP (rpm): Breathing. 14 at rest, up to 24 while working. The breathing sway on the ECG follows it
- HRV (RMSSD ms): Variability. 35-60 ms at rest depending on consistency, drops while working
- NEWS2: Overall early-warning score. The NHS NEWS2 banding applied to HR, SpO2, systolic BP and RR
Rhythms: normal sinus rhythm at rest, tachycardia while working hard, then back to normal. After 2+ days of no activity: bradycardia → irregular rhythm (PVCs) → asystole after 7 days with no activity.
Alarms: NEWS2 5-6 = urgent review, NEWS2 7+ = escalate. The bottom strip shows my last 30 days of contributions.